Home
Utility Intelligence
Memora
Services
Resources
Case Studies
Blog
Events
US Water Utility Market Overview
US Water Utility Regulatory Structure
FAQ
Company
About Us
Contact
Talk to Us
Home
Utility Intelligence
Memora
Services
Resources
Case Studies
Blog
Events
US Water Utility Market Overview
US Water Utility Regulatory Structure
FAQ
Company
About Us
Contact
Aquaintel Blog
Search
Updates
All Blogs
June 16, 2026
Updates
The $620 Billion Challenge: Understanding America’s Water Infrastructure Investment Gap
Vinod Jose
June 12, 2026
Updates
Why Engineers Decide Your Fate (And Most Vendors Learn This Too Late)
Vinod Jose
June 12, 2026
Updates
The Intelligence Imperative: Why Water Vendors Can’t Compete Without Data-Driven Strategies Anymore
Vinod Jose
June 11, 2026
Updates
Strategic Partners vs. Commodity Suppliers: How Intelligence Changes Your Market Position
Vinod Jose
June 11, 2026
Updates
The Lima Water Project Part 2: How Lima Water Built a $4.2M Funding Stack
Vinod Jose
June 11, 2026
Updates
The Lima Water Project Part 1: A Small Utility’s Journey From Infrastructure Crisis to Strategic Funding Success
Vinod Jose
June 10, 2026
Updates
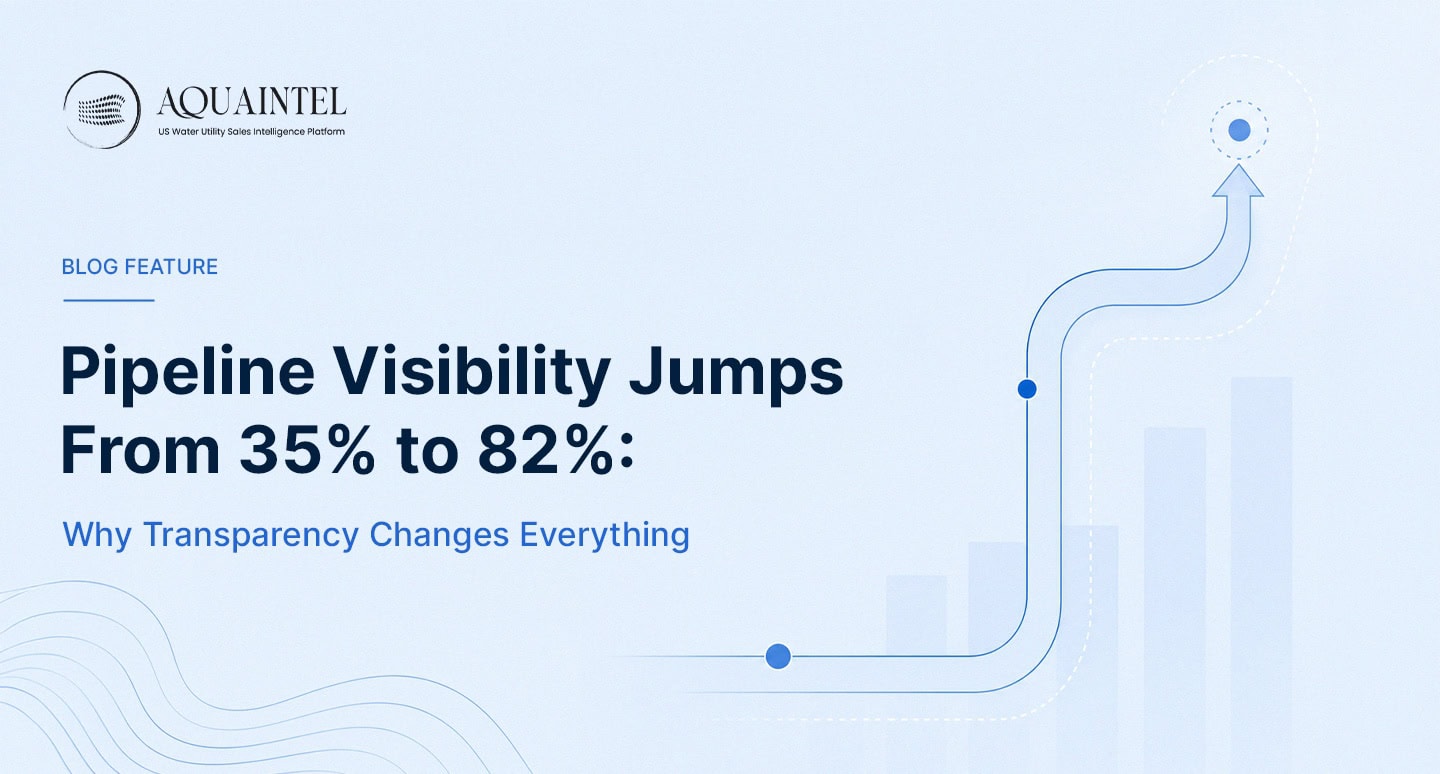
Pipeline Visibility Jumps From 35% to 82%: Why Transparency Changes Everything
Vinod Jose
June 10, 2026
Updates
Reaching 65% of Utilities Instead of 28%: The Coverage Gap Intelligence Actually Closes
Vinod Jose
June 10, 2026
Updates
24-Month Sales Cycles and $1,850 Per Lead: The Real Cost of Selling to Water Utilities
Vinod Jose
June 1, 2026
Updates
Operations, Finance, Executive Leadership, Boards: The Complete Network You’re Missing
Vinod Jose
June 1, 2026
Updates
From Winning the Deal to Owning the Account: Value Articulation and Long-Term Intelligence in Water Sales
Vinod Jose
June 1, 2026
Updates
Intelligent Qualification: Why Chasing Every Opportunity Is Killing Your Win Rate
Vinod Jose
Page
1
Page
2
Page
3